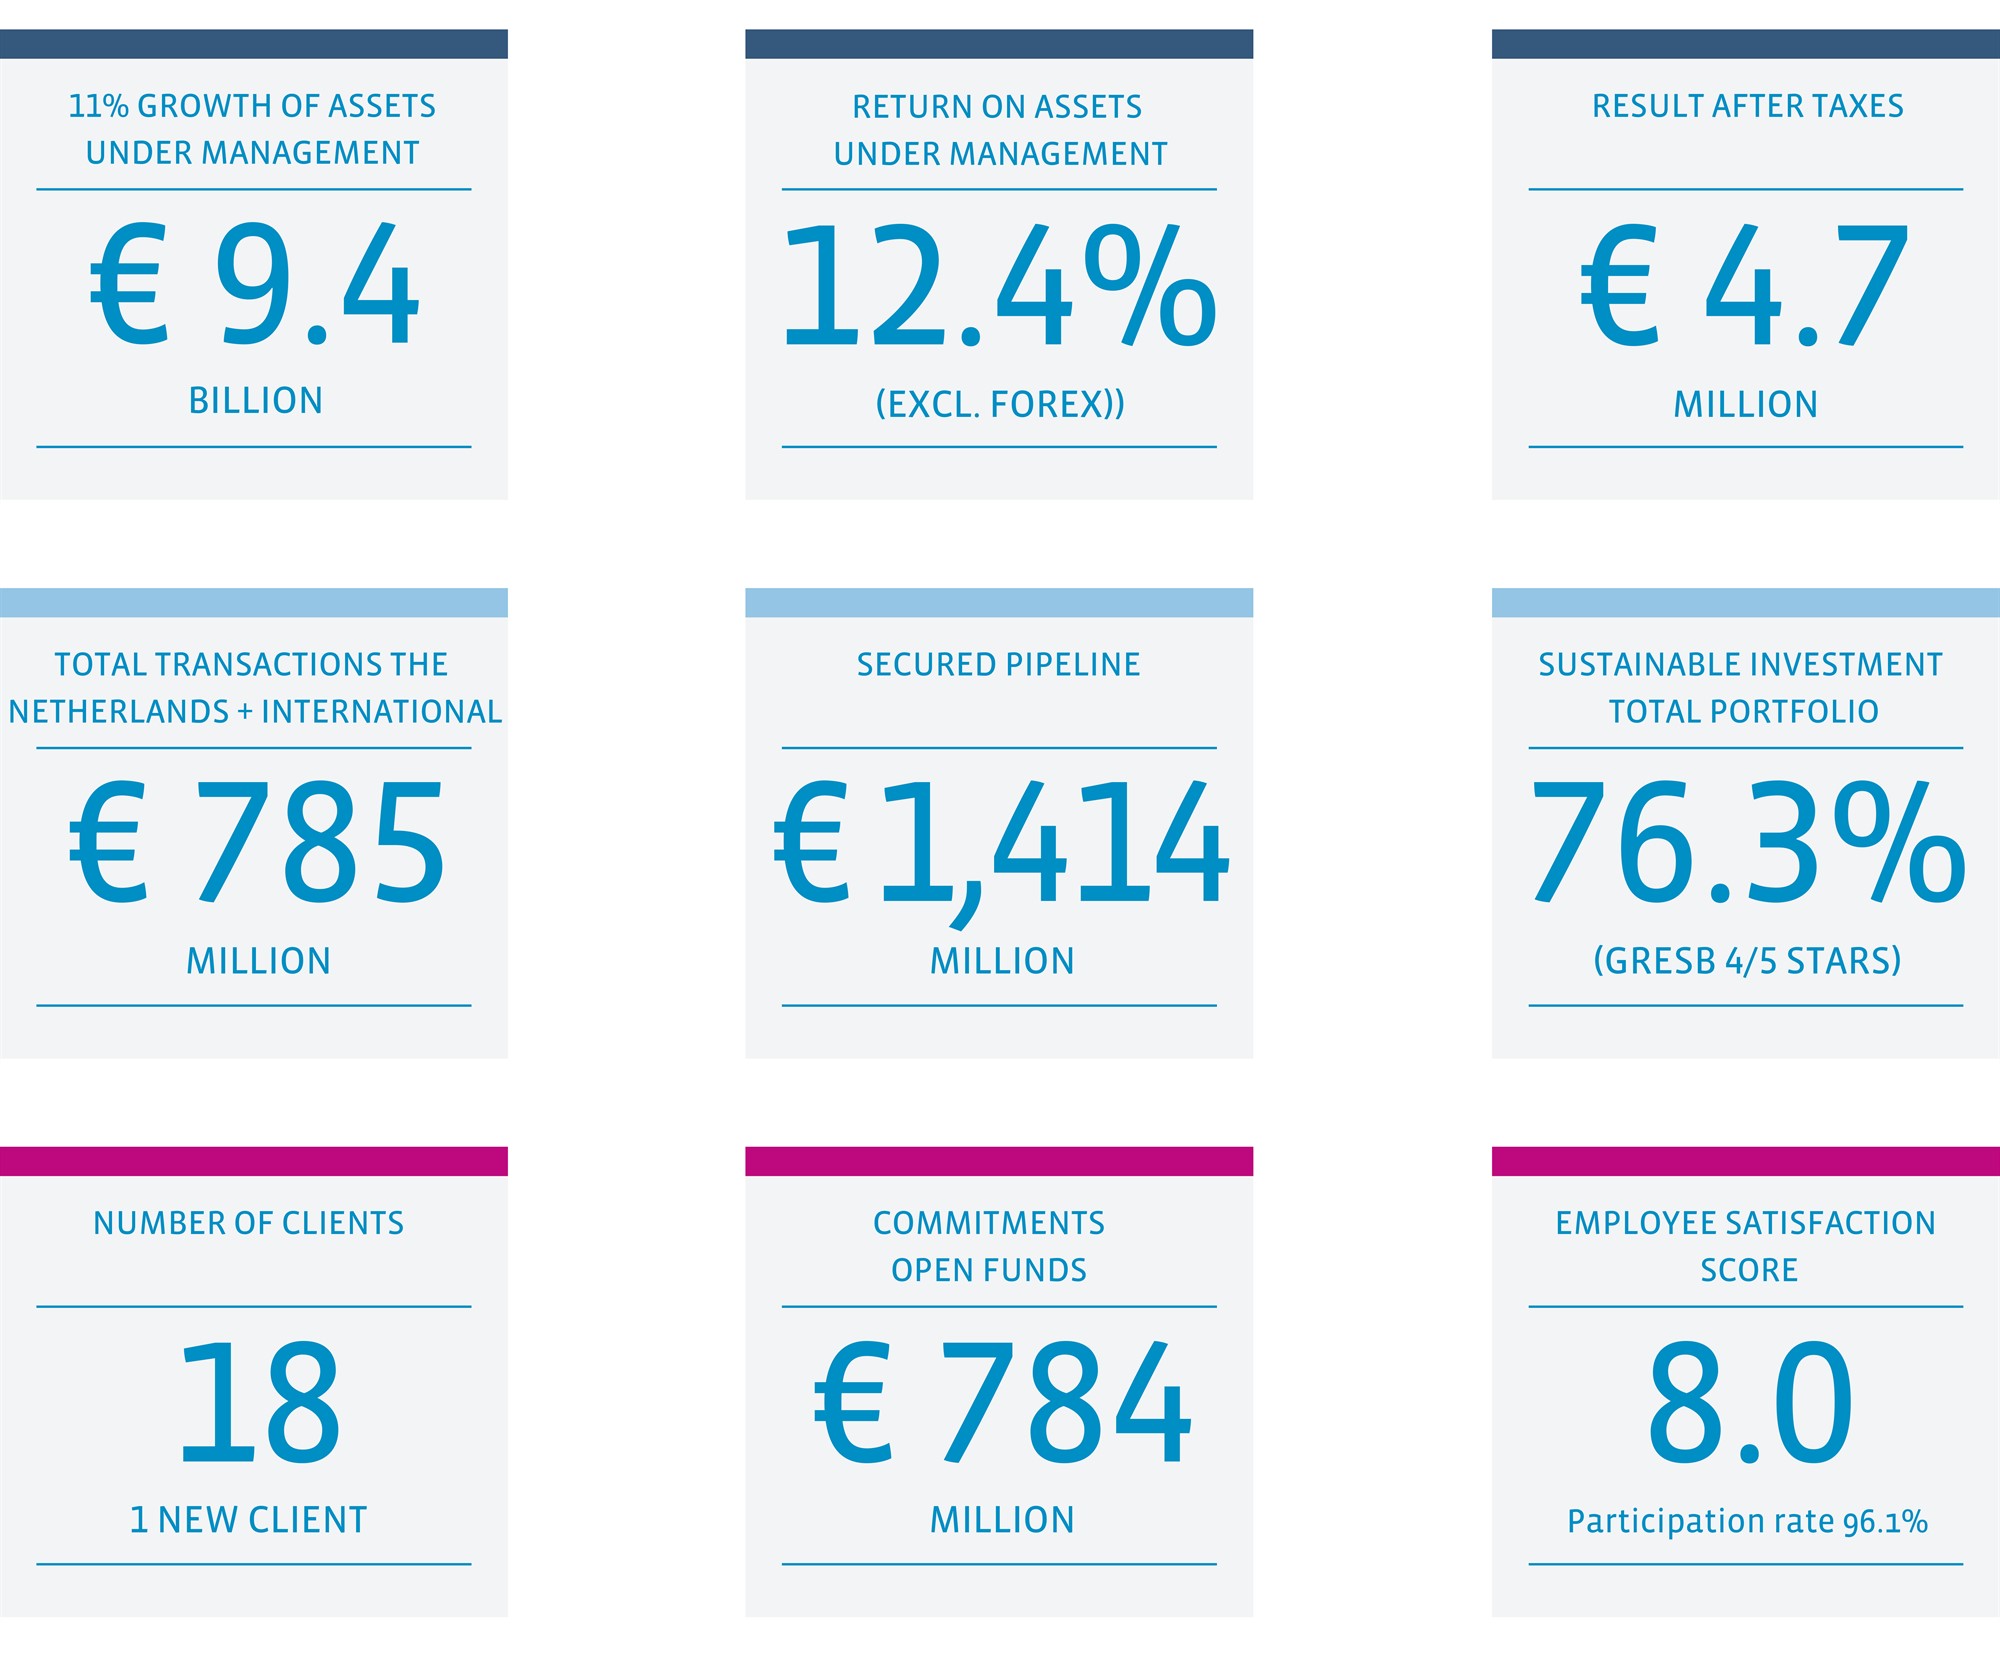
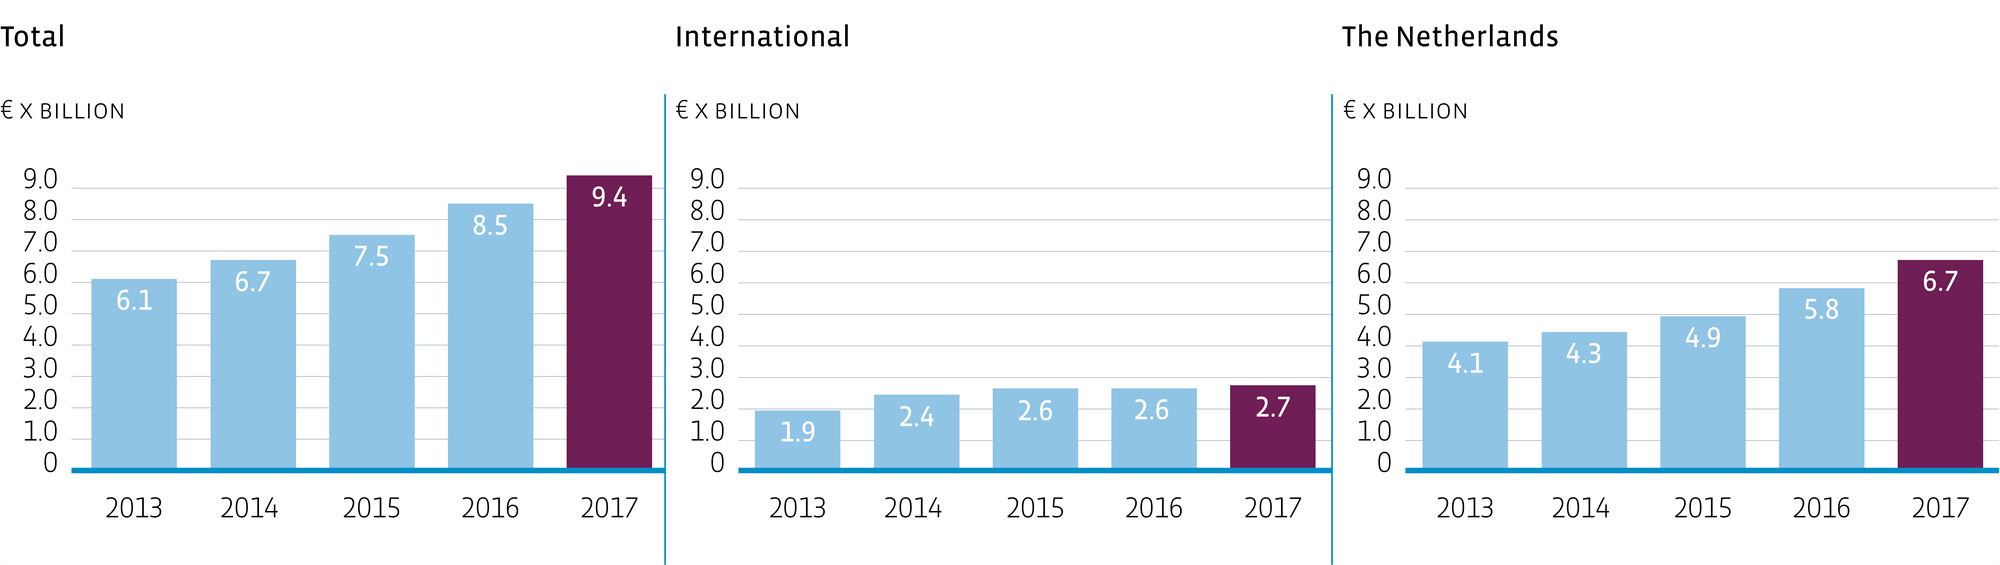
Assets under management
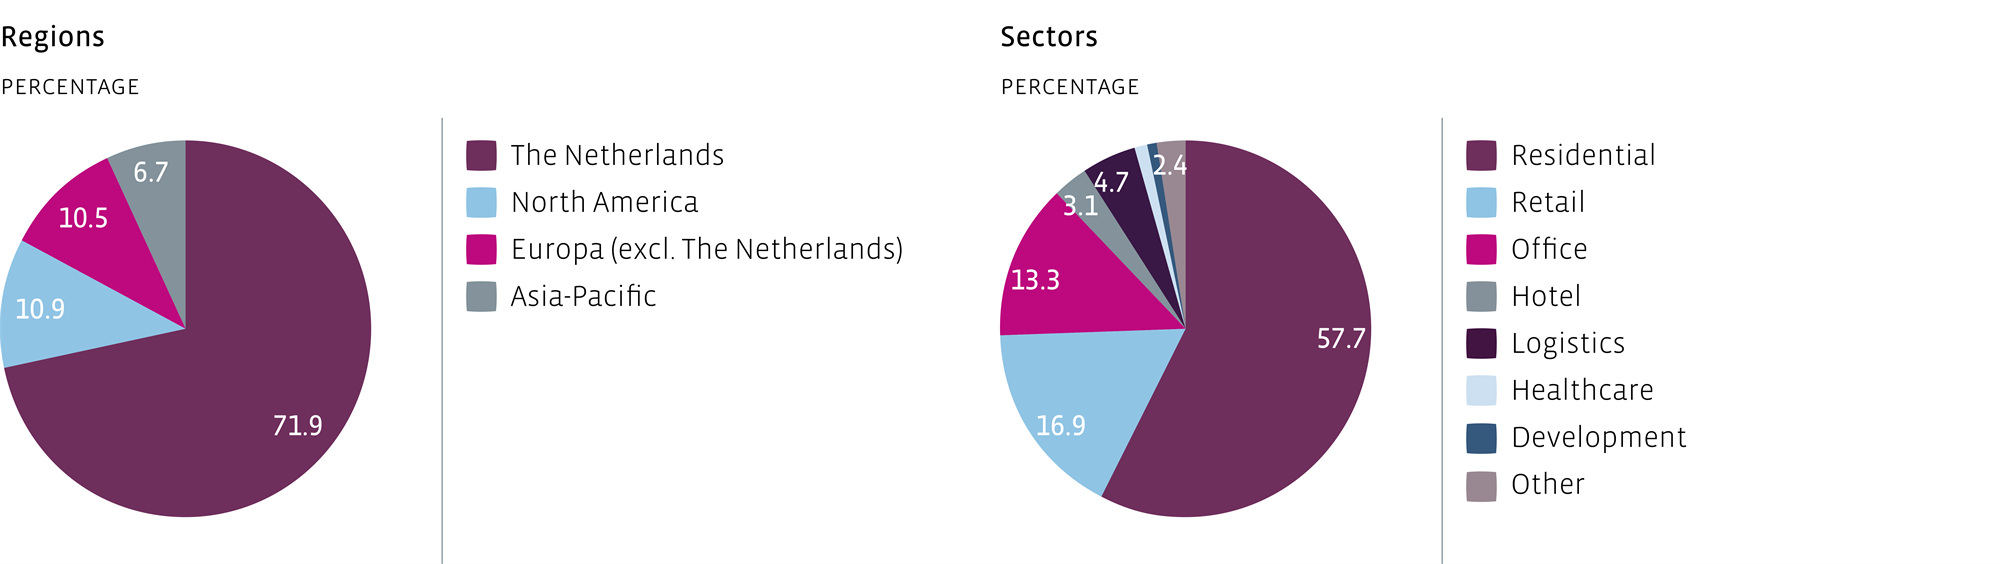
Distribution assets under management total portfolio
Distribution assets under management Dutch funds and international mandates
x € thousands, unless otherwise stated
| | 2017 | 2016 |
Europe mandate | 1,009,180 | 958,419 |
North America mandate | 1,023,604 | 1,148,970 |
Asia-Pacific mandate | 629,427 | 521,634 |
NL Residential Fund | 4,751,642 | 3,995,034 |
NL Retail Fund | 888,894 | 824,201 |
NL Office Fund | 631,446 | 525,988 |
NL Hotel Fund | 221,610 | 189,232 |
NL Healthcare Fund | 112,001 | 53,733 |
Other | 156,206 | 239,658 |
| | 9,424,010 | 8,456,869 |
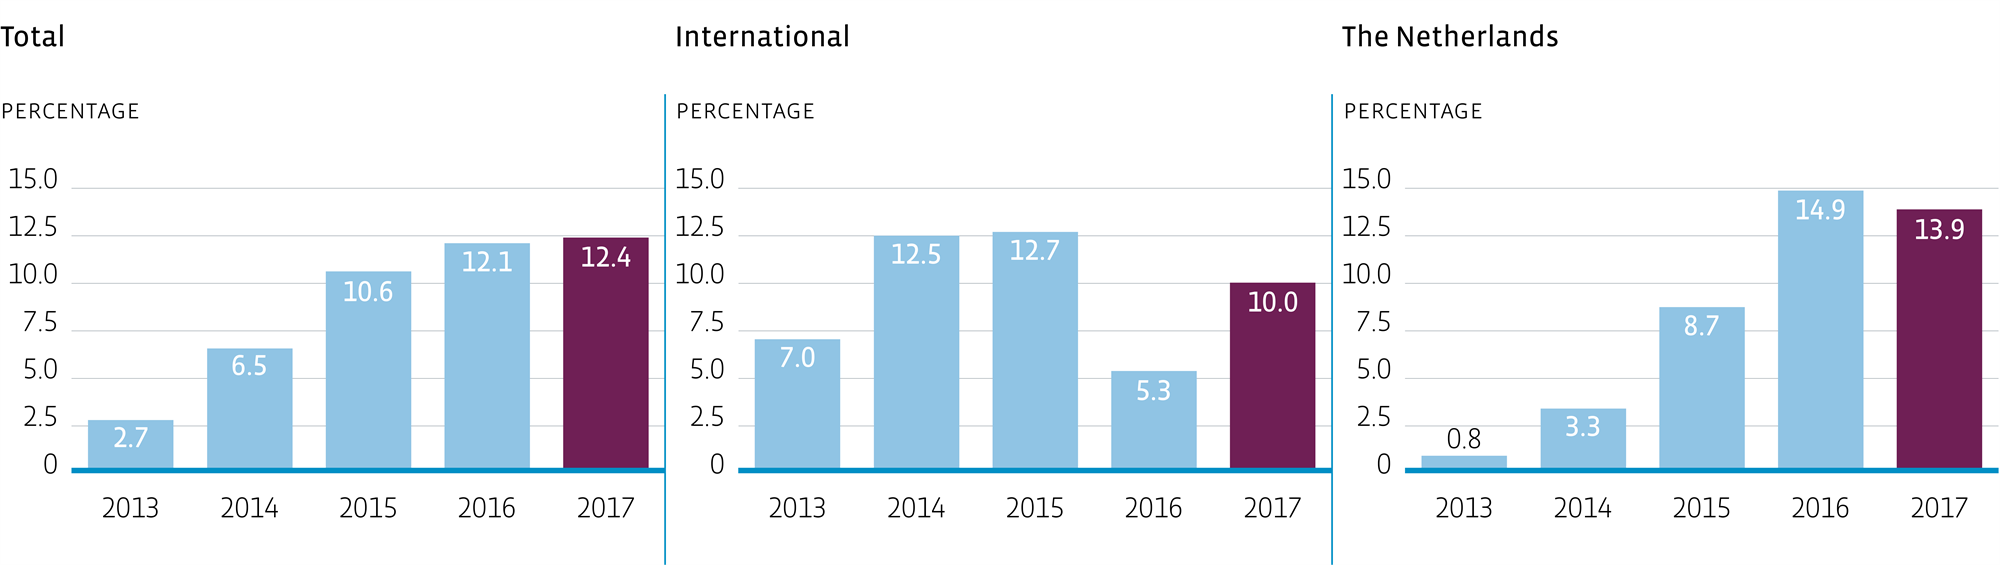
Return on assets under management
Transactions
x € million
Transactions | 2017 | 2016 |
International | | |
Europe (excl. The Netherlands) | 115 | 121 |
North America | 145 | - |
Asia-Pacific | 102 | 158 |
| | 362 | 279 |
| | | |
The Netherlands | | |
Residential Fund | 300 | 249 |
Retail Fund | 50 | 41 |
Office Fund | - | 131 |
Hotel Fund | - | 65 |
Healthcare Fund | 73 | 47 |
| | 423 | 533 |
| | | |
Total | 785 | 812 |
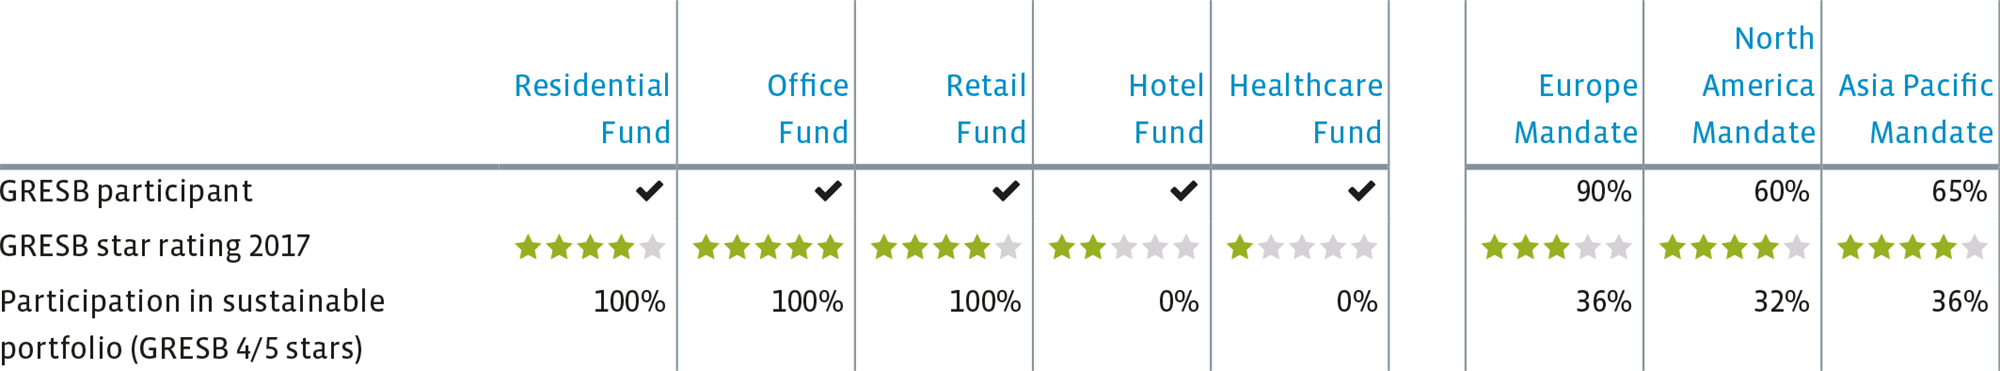
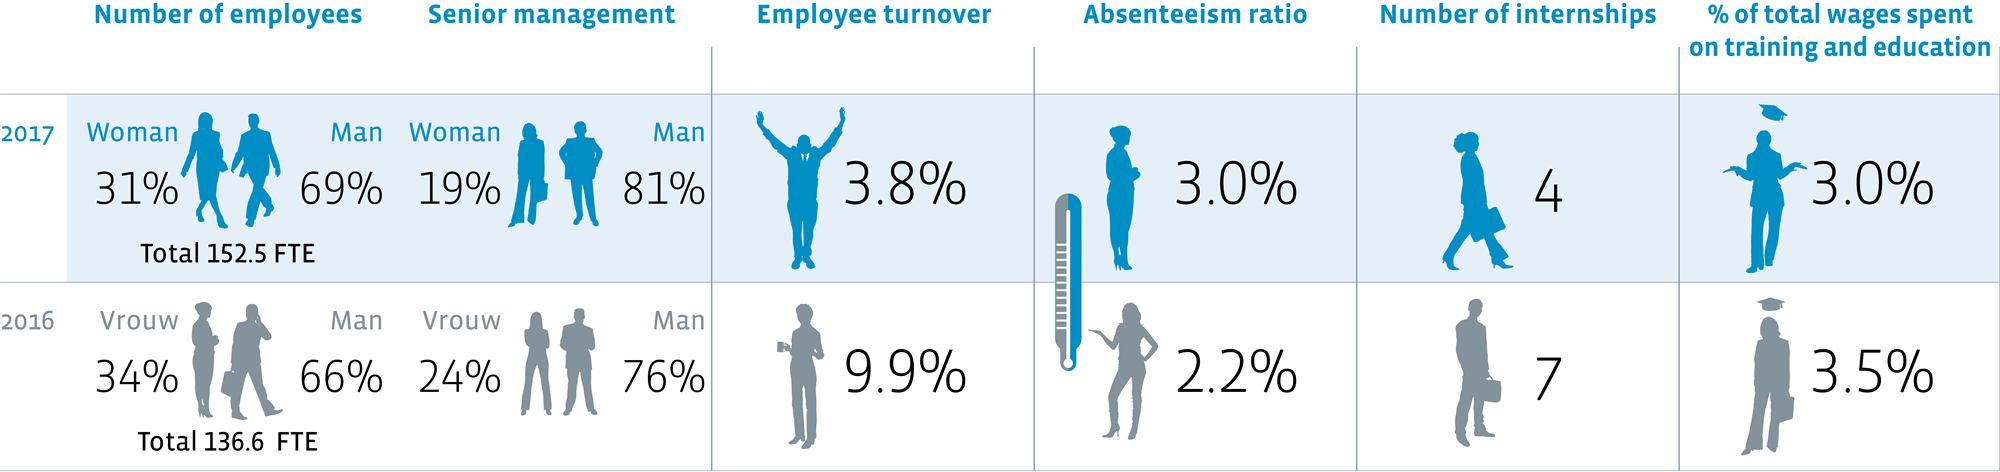
Responsible Investing & Corporate Responsibility
Employees and results satisfaction survey
| | Satisfaction | Engagement | Enthusiasm | Response rate |
Average score 2017 (benchmark financial markets) | 8.0 (7.4) | 8.1 (7.5) | 8.0 (7.3) | 96.1% (81.4%) |
Average score 2015 (benchmark financial markets) | 8.0 (7.4) | 7.7 (7.7) | 7.6 (7.2) | 95.5% (82.0%) |
Key information over five years
x € thousands, unless otherwise stated
| | 2017 | 2016 | 2015 | 2014 | 2013 |
| | | | | | |
Number of shares (actual) | 225,000 | 225,000 | 225,000 | 225,000 | 225,000 |
| | | | | | |
Net result | 4,660 | 2,595 | 4,422 | 3,173 | 4,903 |
Per share | 20.71 | 11.53 | 19.65 | 14.10 | 21.79 |
| | | | | | |
Assets under management | 9,424,010 | 8,456,869 | 7,495,325 | 6,700,206 | 6,060,282 |
| | | | | | |
Total assets | 43,287 | 36,889 | 33,010 | 30,770 | 28,517 |
| | | | | | |
Shareholders’ equity | 33,977 | 29,317 | 29,422 | 27,186 | 24,013 |
Per share | 151.01 | 130.30 | 130.76 | 120.83 | 106.72 |
| | | | | | |
Solvency ratio | 78% | 79% | 89% | 88% | 83% |
| | | | | | |
Management fee income | 34,288 | 30,722 | 30,503 | 27,854 | 27,324 |
| | | | | | |
Personnel costs | 20,846 | 19,276 | 17,959 | 17,014 | 16,815 |
Number of FTEs (year-end) | 152.5 | 136.6 | 131.1 | 128.0 | 122.6 |
Personnel costs per FTE | 136.7 | 141.1 | 137.0 | 132.9 | 137.2 |
Fee per FTE | 224.8 | 224.9 | 232.7 | 217.6 | 222.9 |